The latest media reports say former President Obama left the country with a 4.7 percent unemployment rate. That level is historically low and close to what economists call "full employment."
At the same time, President Trump is said to have won the election because of widespread joblessness in many states. If that was indeed a big factor, these facts do not line up. Both claims can't be true.
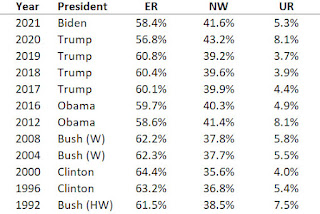
I have heard the argument that the unemployment rate doesn't count people who stopped looking for work during the Obama years, but I've never heard any counter-stats or seen an analysis that explains or adjusts for this. So I decided to do the research and math myself. The above is the result of that research.
As the chart makes clear, there is merit to the claim that the unemployment rate is BS -- or, at least, a poor measure of the jobs situation in America. In fact, I realized it makes much more sense to look at employment rate ("ER" above) rather than unemployment rate ("UR" above) since there are less issues with that number.
As reported by the Bureau of Labor Statistics, the employment number includes anyone 16+ who has a job and is not in prison or the military. Divide that by all people meeting those same requirements, with or without a job, and you get the employment rate.
Here's how that percentage looks for the last seven terms and four presidents:
Obama (2015): 59.3% (2016 data was not yet available)
Obama (2012): 58.6%
Bush (2008): 62.2%
Bush (2004): 62.3%
Clinton (2000): 64.4%
Clinton (1996): 63.2%
Bush Sr (1992): 61.5%
That's Obama's true legacy on jobs in comparison with those who came before him.
You can really see the truth of the issue when you take the inverse of the above percentages, which represents everyone not working for whatever reason, and compare it to the average unemployment rate for the same year:
2008: 37.8% not working, 5.8% average unemployment rate
2012: 41.4% not working, 8.1% average unemployment rate
2015: 40.7% not working, 5.3% average unemployment rate
Notice that 2015's unemployment rate was supposedly 0.5 percentage points better than 2008, and yet those not working was almost 3 percentage points worse! That lends support to the theory that job-seekers had just stopped trying.
This is not meant to hate on Obama or Democrats. Obama served during the second biggest downturn in modern history, and we have no idea if alternate approaches would have made things better or worse. Meanwhile, the Clinton years were legitimately the best years in recent history for employment.
I'll be curious to see how Trump does -- for real -- using this methodology. Will his America surpass the Clinton high of 64.4% employment? Or will it remain around, or sink even lower than, the Obama low of 58.6%?
UPDATE
Today is March 26, 2021, and here is what the updated BLS data shows:
So it seems Trump did not exceed the Clinton highs (or even the W highs), but he beat Obama in every year except 2020. Of course: Covid-19 threw a major monkey wrench into this analysis. It's hard to assess any year after 2019 fairly because the pandemic shut down the economy.
Sitting here in 2022, Biden is taking a lot of political heat for his economic policies. But for this analysis, it also isn't fair to compare yet because of the pandemic.

